
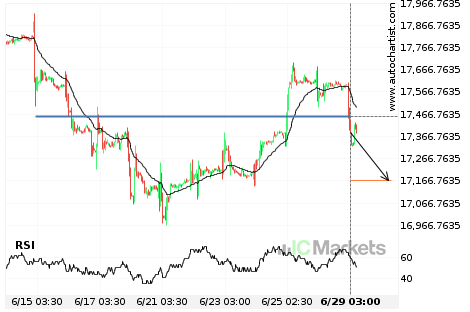
Big movement expected on FTSE China A50 Index
FTSE China A50 Index has broken through a line of 17455.5391 and suggests a possible movement to 17169.9590 within the next 2 days. It has tested this line numerous times in the past, so one should probably wait for a confirmation of this breakout before placing a trade. If the breakout doesn’t confirm, we could […]

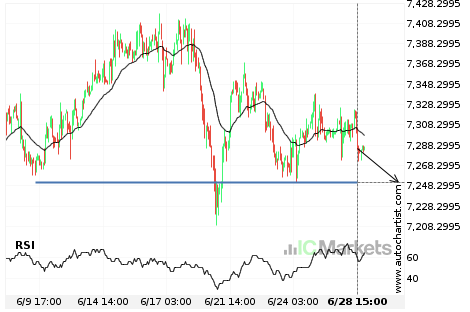
Australia 200 Index approaching important 7251.9199 price line
Australia 200 Index is approaching the support line of a Support. It has touched this line numerous times in the last 20 days. If it tests this line again, it should do so in the next 3 days.
Australia 200 Index approaching important 7251.9199 price line
Australia 200 Index is approaching the support line of a Support. It has touched this line numerous times in the last 20 days. If it tests this line again, it should do so in the next 3 days.
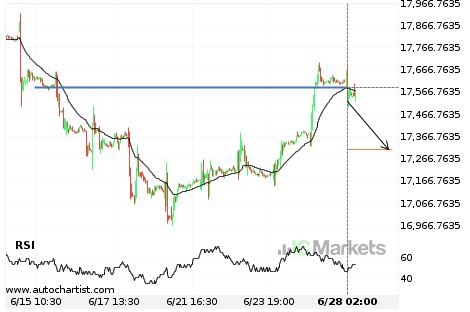
Big movement expected on FTSE China A50 Index
FTSE China A50 Index has broken through a line of 17585.1895 and suggests a possible movement to 17309.0488 within the next 2 days. It has tested this line numerous times in the past, so one should probably wait for a confirmation of this breakout before placing a trade. If the breakout doesn’t confirm, we could […]
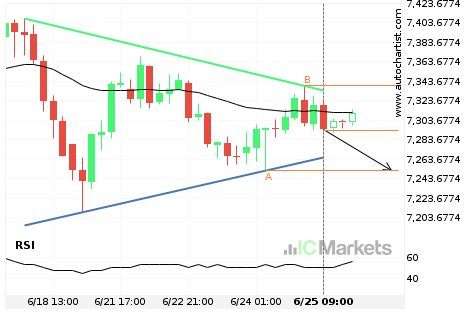
Either a rebound or a breakout imminent on Australia 200 Index
Australia 200 Index is heading towards the support line of a Triangle. If this movement continues, we expect the price of Australia 200 Index to test 7251.9200 within the next 2 days. But don’t be so quick to trade, it has tested this line numerous times in the past, so this movement could be short-lived […]
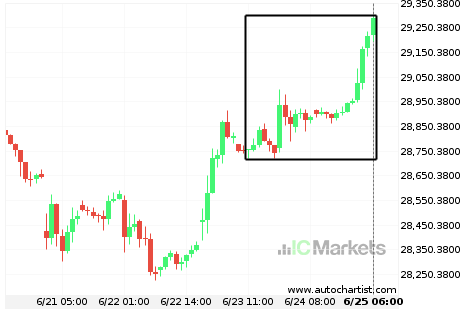
Hong Kong 50 Index experienced an exceptionally large movement
For those of you that don’t believe in trends, this may be an opportunity to take advantage of an exceptional 1.85% move on Hong Kong 50 Index. The movement has happened over the last 2 days. For those trend followers among you, you may think about riding this trend.

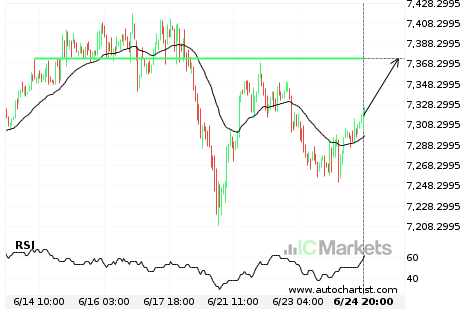
Australia 200 Index approaching important 7374.0801 price line
Australia 200 Index is approaching the resistance line of a Resistance. It has touched this line numerous times in the last 11 days. If it tests this line again, it should do so in the next 2 days.
Australia 200 Index approaching important 7374.0801 price line
Australia 200 Index is approaching the resistance line of a Resistance. It has touched this line numerous times in the last 11 days. If it tests this line again, it should do so in the next 2 days.
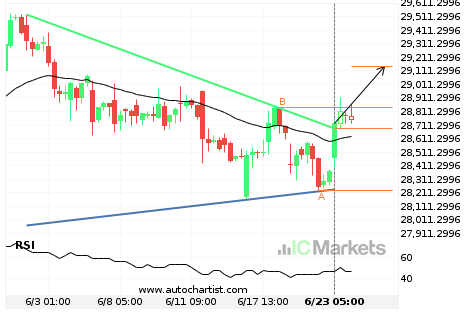
Hong Kong 50 Index has broken through resistance
Hong Kong 50 Index has broken through the resistance line of a Triangle. It has touched this line at least twice in the last 22 days. This breakout indicates a potential move to 29142.2110 within the next 3 days. Because we have seen it retrace from this positions in the past, one should wait for […]